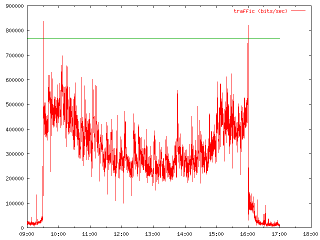
 UNIX enthusiasts often tell you just how powerful UNIX is and just how easy it is to make it perform complex tasks that are only possible using expensive software packages under other operating systems. A recent case I encountered illustrates this point very well.
The problem: at a client site, we noticed that their network traffic reached critical levels (read: in excess of their DSL bandwidth) at certain times of the day. At first, we began monitoring network traffic "by hand", simply by looking at the byte statistics you can find in /proc/dev/net. Easy enough, but not very informative; it takes an exercise in mental gymnastics to subtract the correct figures and divide by the properly counted number of seconds to arrive at the right answer.
This was automated easily enough of course, with a simple shell script repetitively read /proc/dev/net and produced formatted output. The next idea was fairly obvious; capturing this output in a file, and then using it with a spreadsheet program to produce a daily chart.
But why do all this by hand? Wouldn't it be neat if it were possible to have the server collect all these statistics by itself, and at the end of the day, send an e-mail with the results?
As a matter of fact, this is not only possible, it is actually quite simple. And educational, too, as it combines tools like gnuplot, sendmail, uuencode, and shell programming to produce a useful, elegant result: a daily e-mail in your mailbox with a GIF attachment.
The code is simple and speaks for itself. I added a few comments for clarity.
#!/bin/sh

# Function to extract a field from a network statistic line
count()
{
    COUNT=`cat /proc/net/dev | grep $1 | sed -e ";s/:/ /g;" | \
    sed -e ":;s/  / /g;t" | cut -d " " -f $2`
}

cd /tmp
FILENAME=monlog-`date +%Y%m%d`
(
    while [ "`date +%H%M`" != "1700" ] ; do
        # Extract field 3 (received bytes)
        count eth0 3
        E0a=${COUNT}

        # data is in bytes; N bytes in 8 seconds is N bits/sec
        sleep 8

        count eth0 3
        E0b=${COUNT}

        echo -e `date | sed "s/  / /" | cut -d " " -f 4` "\teth0:  " $((E0b-E0a))
    done
) > ${FILENAME}

# Using gnuplot to plot time series data into a GIF file
# We also plot a constant line indicating the maximum DSL bandwidth
gnuplot >monlog.gif <<-EOF
    set xdata time
    set timefmt "%H:%M:%S"
    set terminal gif
    plot '${FILENAME}' using 1:3 title "traffic (bits/sec)" with lines, 768000 notitle
EOF

# Using sendmail to send the result in a MIME multipart mail
# MIME separator string
BOUND=Traffic_`date +%Y%m%d`
(
    echo "\
Subject: Daily traffic (`date`)
To: vttoth
MIME-Version: 1.0
Content-type: multipart/mixed; boundary=\"${BOUND}\"

--${BOUND}
Content-Type: text/plain;

Daily DSL traffic summary.

--${BOUND}
Content-Type: application/octet-stream; name=\"monlog.gif\";
Content-transfer-encoding: x-uuencode
"
    uuencode monlog.gif <monlog.gif 2>/dev/null
    echo
    echo --${BOUND}--
) | sendmail  -t
rm monlog.gif 2>/dev/null
Once this script was ready and debugged, I added it to the daily crontab file. Invoked at 9 AM every weekday morning, it runs until the end of the workday, and then creates and sends its result.
Needless to say, the script can easily be adapted to suit specific needs. For instance, I now use a variant of this script to plot both the sent and the received data volume on an ISDN line.


